
Analytics tab
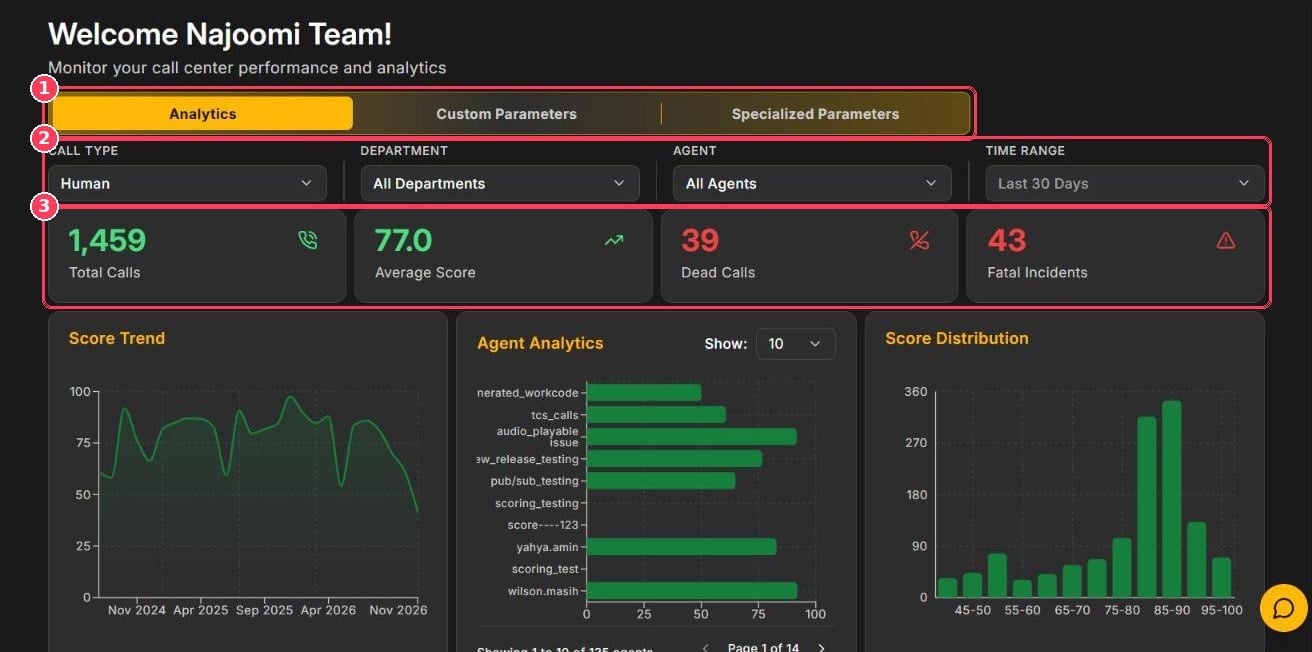
Dashboard — Analytics tab
Filters
Summary cards
Charts
Reading Category Parameters: an obtained score of 3.52 against an out-of score of 4.2 means calls earned, on average, 3.52 of 4.2 possible points for that parameter — about 84%.
Custom Parameters tab
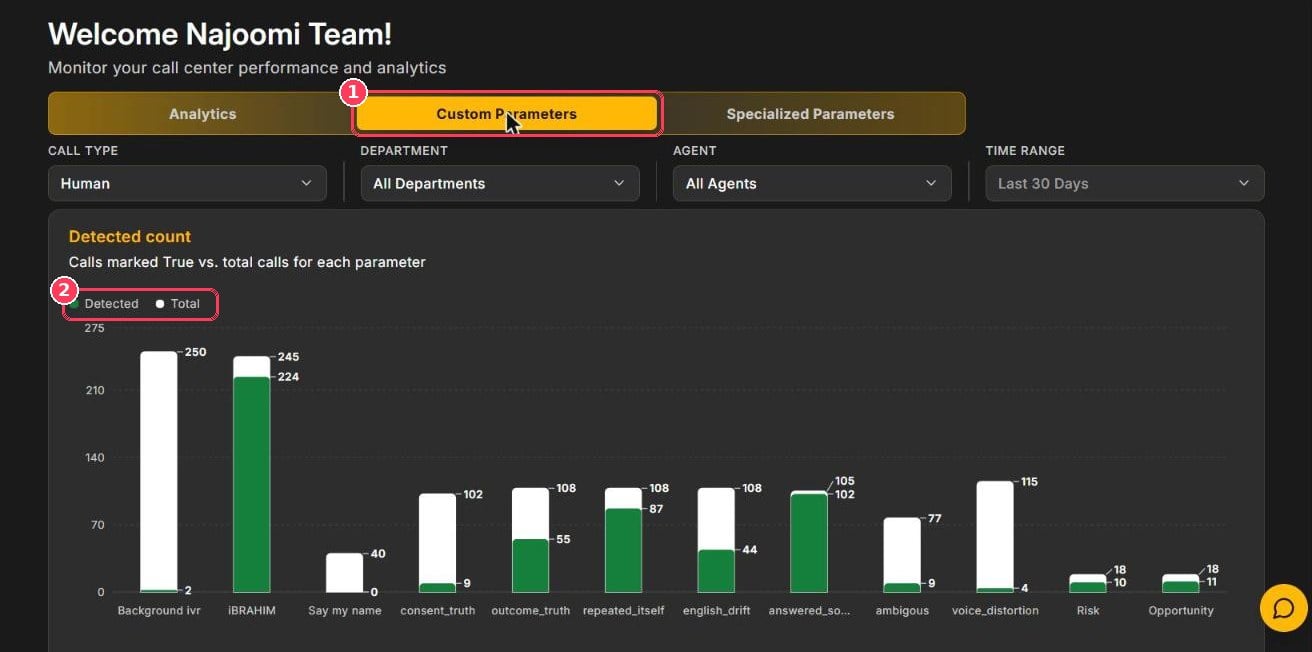
Dashboard — Custom Parameters tab
Below the Detected count chart, Parameters Score compares the average score per call with the maximum possible score (Out of) for each scored parameter. Use the pagination under each chart to see all parameters, and Add Parameter to create a new one.
Specialized Parameters tab
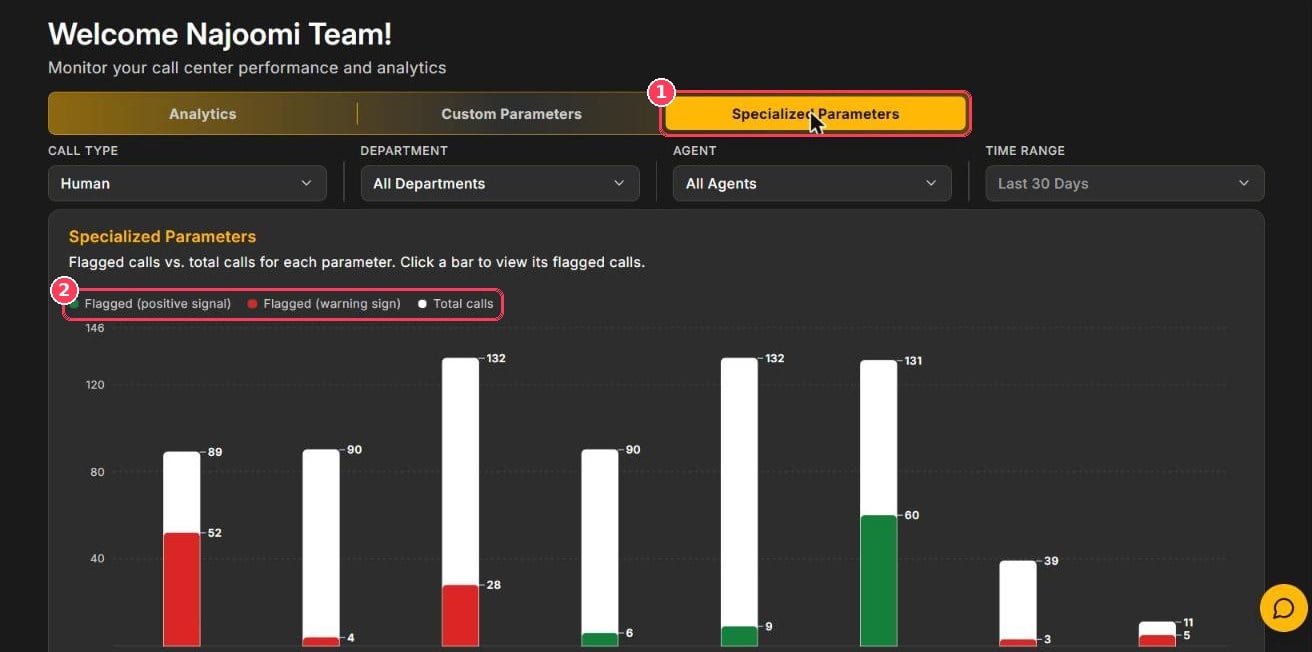
Dashboard — Specialized Parameters tab
To investigate a tracker: click its bar or select View calls under its name. Xperia opens Call Scoring filtered to the flagged calls.
Recommended weekly review
1
Set the scope
Choose the call type, department, and time range.
2
Check the headline numbers
Compare Average Score, Dead Calls, and Fatal Incidents with the previous period.
3
Find outliers
Use Agent Analytics and Score Distribution to find low-scoring agents and calls.
4
Find the cause
Use Category Parameters and the Custom Parameters tab to see which behaviors lose the most points.
5
Listen to real calls
Open the calls behind the numbers before you coach.